NEET 2021 Chemistry Question 82 Solution
Question
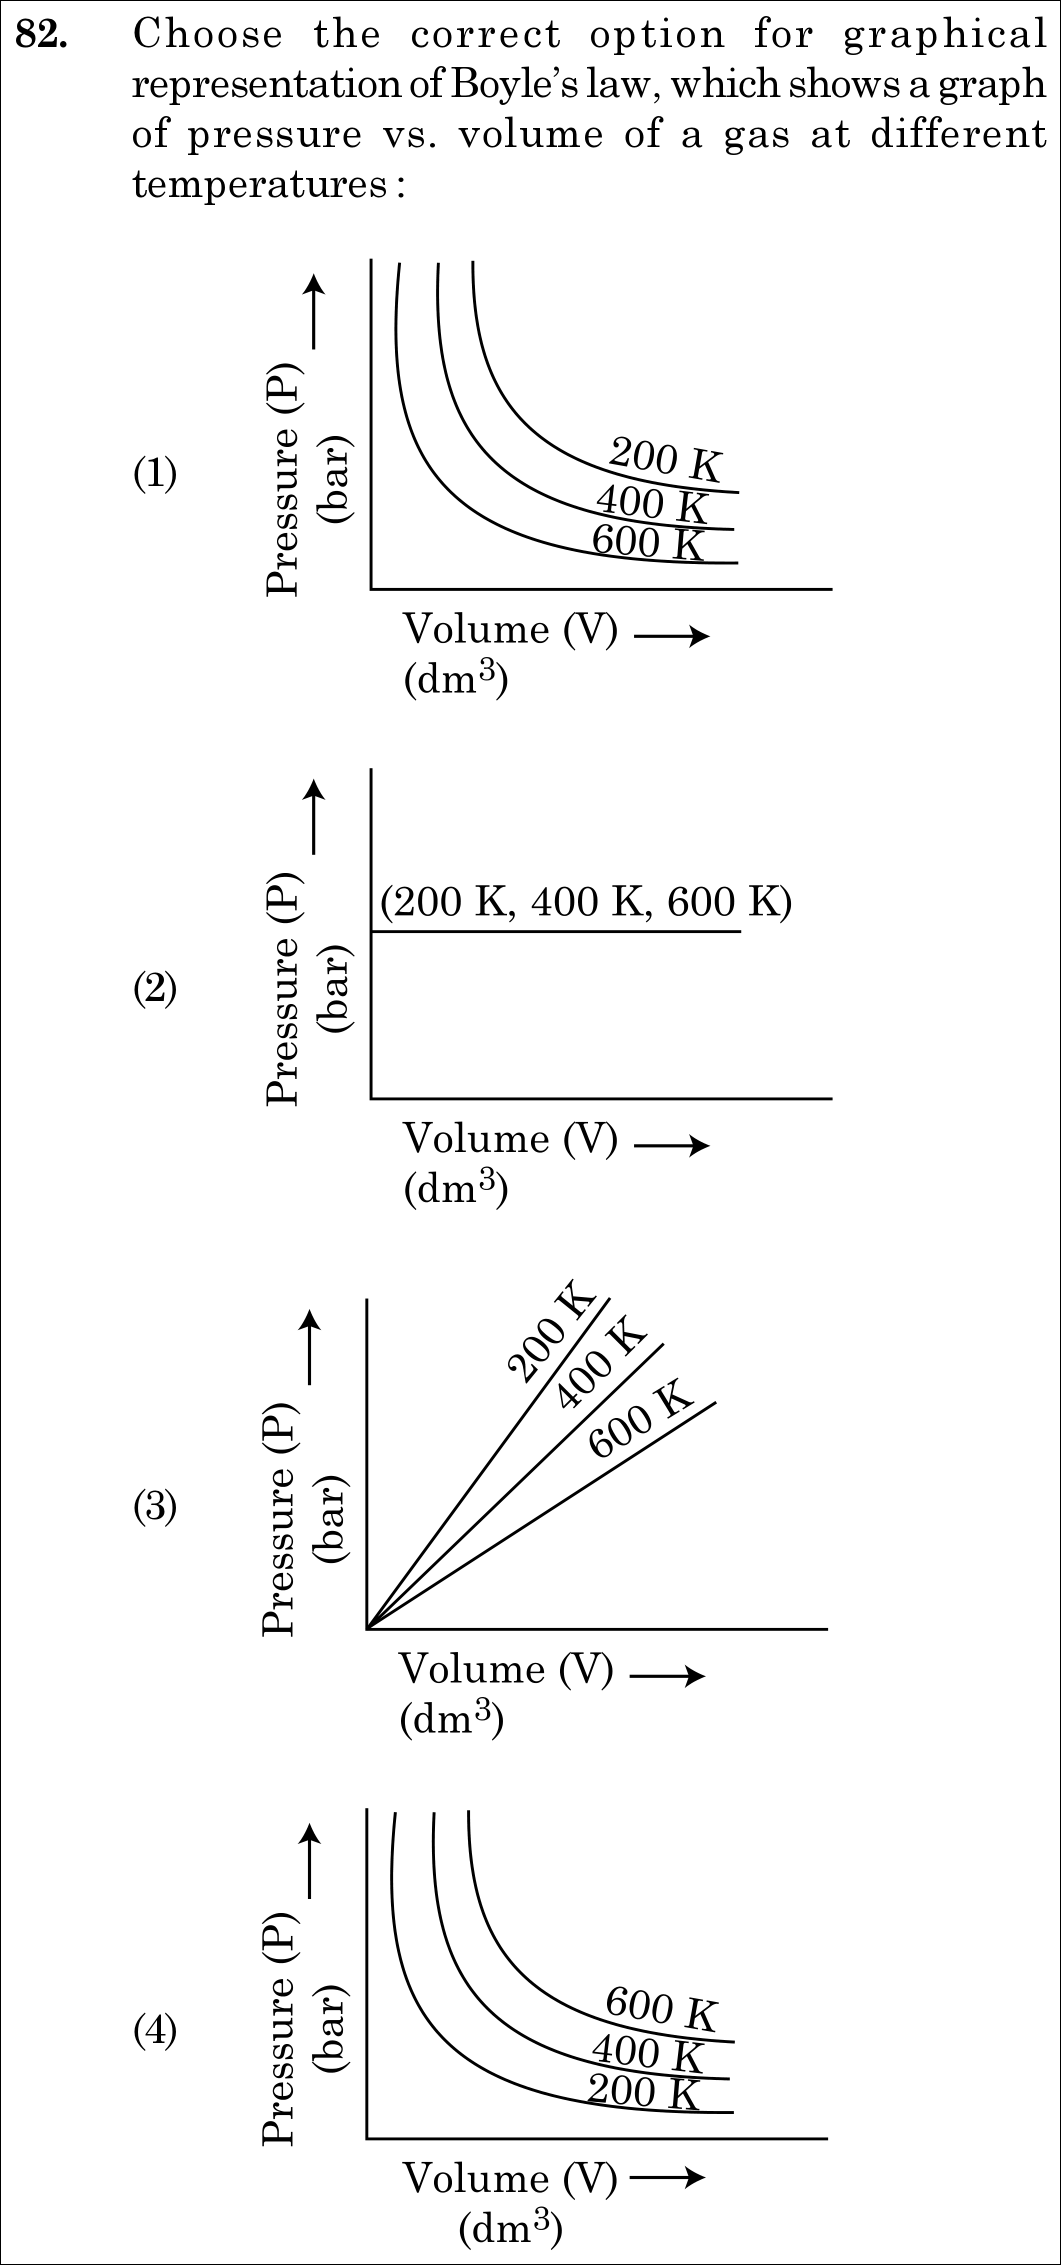
Choose the correct option for graphical representation of Boyle's law, which shows a graph of pressure vs. volume of a gas at different temperatures:
Dynamic 180-question full-length simulator mixed dynamically from all 6 years for 2027 & 2026 aspirants.
Choose the correct option for graphical representation of Boyle's law, which shows a graph of pressure vs. volume of a gas at different temperatures:
From ideal gas equation , at any fixed volume , pressure is directly proportional to temperature: . Thus, the highest temperature isotherm () must lie at the highest pressure, followed by , and the lowest is . The curves are rectangular hyperbolas. This corresponds uniquely to Graph (4)! Match Option (4)!
Boyle's law states that at constant temperature , the pressure of a fixed mass of gas is inversely proportional to its volume: A plot of versus at constant temperature gives a rectangular hyperbola called an isotherm.
The constant is directly proportional to the absolute temperature . A higher temperature corresponds to a larger value of . For any given volume on the horizontal axis:
- Graph (1): Inverted temperature labels ( is shown at top and at bottom), which violates thermodynamics. - Graph (2): Shows pressure independent of volume (horizontal line), which is false. - Graph (3): Shows linear increase (), which is isobaric/Charles law plot type, not vs . - Graph (4): Shows three hyperbolic isotherms with on top, in the middle, and at the bottom. This is the exact NCERT textbook plot.
Diagnose every choice: Know exactly why the right option works and why distractors fail.
Inverted temperature order (places above ).
Horizontal line implies pressure is independent of volume, completely violating Boyle's law.
Straight lines through origin represent direct proportionality (), not inverse.
Flawless representation of Boyle's law isotherms with .
Candidates who know the curves are hyperbolas often rush and pick Graph (1) without checking the temperature labels. Graph (1) places at the top, which is physically impossible. At higher temperature, gas particles have higher kinetic energy and exert GREATER pressure, shifting the curve UPWARDS (Graph 4).
"Each curve on a P-V graph corresponds to a different constant temperature and is known as an isotherm. Higher curves correspond to higher temperatures."
Test your speed and accuracy in the authentic 200-minute timed NTA simulator.
Spotted a mistake in this solution? Report an error (support@mycompetitiveexams.com)
Cover all 1,140 official NEET questions in 285 days at your own pace. Progress is saved on your device. No login needed.