MyCompetitiveExams Logo MyCompetitiveExams
Search 1,140+ Questions
Chapters, formulas, speed tricks
→
⚡ Brahmastra NEET 2027
720 MARKS

Dynamic 180-question full-length simulator mixed dynamically from all 6 years for 2027 & 2026 aspirants.

Launch Brahmastra 2027 Test →
Start Practice →
100% Free · No Login Required
Q.163 Physics ⭐ 360° Option Elimination Active
Vault ↗

NEET 2020 Physics Question 163 Solution

Topic: Current Electricity · Official NTA Booklet Code E1
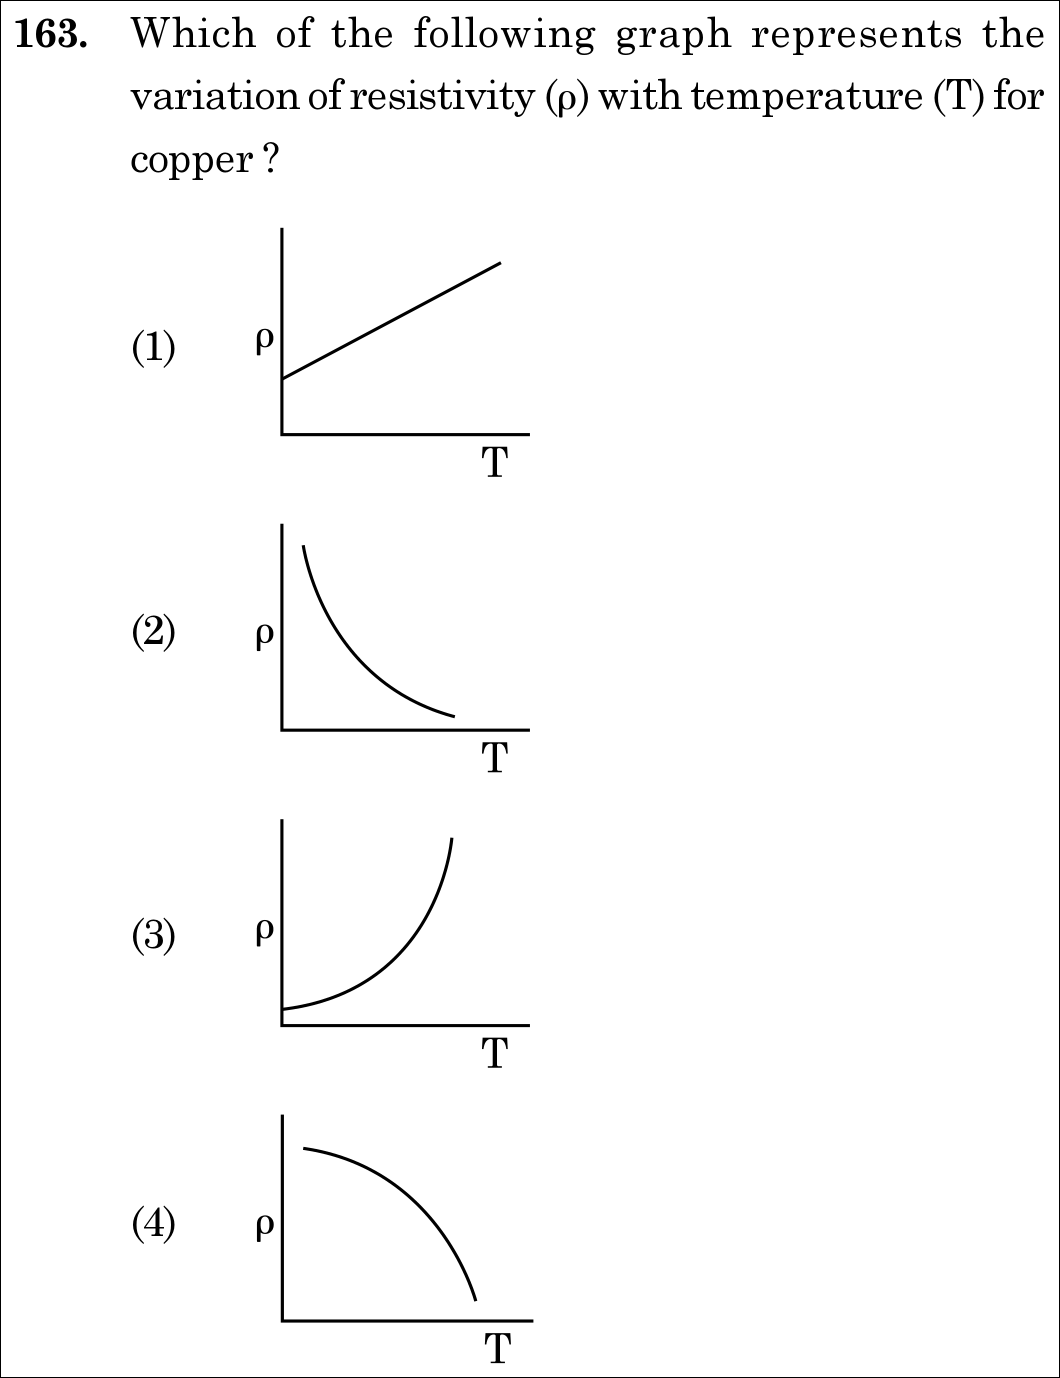
NEET 2020 Physics Question 163: Temperature Dependence of Resistivity for a Metallic Conductor (Copper)

Question

Which of the following graph represents the variation of resistivity (ρ) with temperature (T) for copper?

✓
Verified Against NTA Final Answer Key
Option (3) : Non-linear concave-upward curve starting near origin
📚 Current Electricity Medium
📋 Given Parameters & Problem Setup
Material Copper (pure metal)
Variable Plotted Resistivity (rho) vs Absolute Temperature (T in K)
⚡

The 30-Second Exam Hall Shortcut: ⚡ "Direct NCERT Graph: Pure copper shows non-linear variation (concave upward) at low T and becomes linear at higher T. Graph (3) is canonical!"

⏱️ 20 seconds

In standard NCERT, resistivity of copper vs temperature in Kelvin is plotted as a non-linear curve starting very low near 0 K and curving upwards (concave upward). Semiconductor resistivity decreases exponentially, alloys like Nichrome have a high non-zero intercept with linear rise, but pure copper displays the curved non-linear rise of Graph (3)!

1 Recall resistivity relation: ρ=mne2τ\rho = \frac{m}{n e^2 \tau}.
2 At low temperatures (T<50 KT < 50\text{ K}), electron-phonon scattering makes ρ∝T5\rho \propto T^5 (Bloch-Grüneisen law), producing a concave upward curve.
3 At higher temperatures, it transitions smoothly into a linear rise (ρ∝T\rho \propto T).
4 NCERT plot matches Graph (3) uniquely.
🛡️
Why You Can 100% Trust This Shortcut: NCERT Physics · Current Electricity (Temperature Dependence of Resistivity for Copper)
📐

Step-by-Step Rigorous Workflow & Mathematical Proof

Step 1

Microscopic Basis of Metallic Resistivity

For metals, resistivity is given by Drude-Lorentz model: ρ=mne2τ\rho = \frac{m}{n e^2 \tau}, where nn is the free electron density and τ\tau is relaxation time. As temperature increases, lattice vibrations (phonons) increase, shortening τ\tau and increasing ρ\rho.

Step 2

Low Temperature Behavior of Pure Metals

For pure metals such as copper, at temperatures close to absolute zero (0 K0\text{ K} to 50 K50\text{ K}), resistivity increases non-linearly with temperature (proportional to T5T^5 according to quantum electron-phonon scattering theory).

Step 3

High Temperature Linear Regime

As temperature exceeds 100 K100\text{ K}, the rate of increase settles into a nearly linear dependence (ρ=ρ0[1+α(T−T0)]\rho = \rho_0 [1 + \alpha(T - T_0)]). Thus the full plot starting from 0 K0\text{ K} curves upward initially.

Step 4

Examine Given Graphical Options

- Graph 1: Decreasing exponential (typical of intrinsic semiconductors). - Graph 2: Constant horizontal line (temperature-independent ideal resistor). - Graph 3: Curved upward non-linear plot starting near origin (exact NCERT plot for Copper). - Graph 4: Pure straight line passing through origin (neglects quantum low-temperature non-linearity). Therefore, Graph 3 is the correct representation.

⭐

360° Option Elimination Engine Key Feature

Diagnose every choice: Know exactly why the right option works and why distractors fail.

4-Option Deep Scan
1 A
✗ Incorrect
Verdict & Scientific Reason:

Incorrect; depicts semiconductor behavior where thermal excitation generates more charge carriers.

⚠️
Student Fallacy (Why candidates pick this trap): Confusing conductor with semiconductor.
2 B
✗ Incorrect
Verdict & Scientific Reason:

Incorrect; depicts a zero temperature coefficient material (ideal standard resistor), not pure copper.

⚠️
Student Fallacy (Why candidates pick this trap): Assuming metal resistivity is independent of temperature.
3 C
✓ 100% Correct
Verdict & Scientific Reason:

Canonical NCERT curve for copper showing non-linear increase at low T transitioning to linear at higher T.

💡
Why this is airtight: None; authentic textbook diagram recognition.
4 D
✗ Incorrect
Verdict & Scientific Reason:

Incorrect; ignores the well-known low-temperature non-linear curvature in pure copper.

⚠️
Student Fallacy (Why candidates pick this trap): Over-simplifying metal resistivity as strictly linear at all temperatures.
⚠️

NTA Trap Alert: Approximated vs Exact Temperature Curves

The formula ρ=ρ0(1+αΔT)\rho = \rho_0(1 + \alpha \Delta T) is a linear approximation over narrow temperature ranges. Over the full range from 0 K, the curve is distinctly non-linear.

🛡️ How to avoid the -1 mark: Remember the NCERT triad: Copper (curved upward), Nichrome (straight line with large positive intercept), Semiconductor (exponential decay).
📖

Core NEET Syllabus Standard

Physics · Current Electricity Standard Benchmark
Core Scientific Principle Tested:

""

Syllabus Focus: Temperature Dependence of Resistivity for a Metallic Conductor (Copper)
✓ Core NEET UG Syllabus Anchor Syllabus & Academic Standards ↗

Ready to attempt under real exam pressure?

Test your speed and accuracy in the authentic 180-minute timed NTA simulator.

Launch NEET 2020 CBT Test →

Spotted a mistake in this solution? Report an error (support@mycompetitiveexams.com)

⚖️ Legal & Fair Dealing Notice: Sourced from publicly released NEET 2020 question papers and NEET answer keys for private study, research, and non-commercial educational practice under Fair Dealing (Section 52(1)(a) of the Indian Copyright Act, 1957). Not affiliated with or endorsed by NTA or NMC.

Solve 4 NEET Questions a Day — One per Subject

Cover all 1,140 official NEET questions in 285 days at your own pace. Progress is saved on your device. No login needed.